Concentration Scanning Technology for Nanoparticle Concentration Determination using Nanoparticle Tracking Analysis (NTA)
Authors
Esther Blazquez-Gonzalez, Dr. Lena Ball, Dr. Sascha Raschke, Dr. Henry Dehne, Particle Metrix GmbH, Inning, Germany
Abstract
The accurate and reliable determination of nanoparticle concentration is crucial for a wide range of applications. It is essential for the product release of technical particles like calibration standards as well as for the quantification of extracellular vesicles (EVs) in biopharmaceutical research, where they serve as biomarkers for diseases or are used in the development of effective and safe therapeutics. However, the experimental results of nanoparticle concentration measurements in scatter and fluorescence modes are highly dependent on recording settings in both flow cytometry (FC) and nanoparticle tracking analysis (NTA). Therefore, calibration with reference material is necessary to precisely measure samples that vary in material, particle size, and fluorescence, ensuring accurate results.
In this technote, we present our new developed Concentration Scanning Technology, a new concentration measurement method using a continuous microscopy scan throughout the entire measuring cell, which is implemented in our new software ZetaSphere. The new method significantly reduces the influence of variable camera levels, enabling quick and accurate concentration determination without additional calibration. This in turn facilitates the comparison and measurement of fluorescent particles as well as particles of different sizes and materials, and ensuring reproducible results across different devices. Overall, our new concentration scan is a simpler, faster and more precise measurement method that is easy to use for a wide range of samples and applications, providing reproducible results over a wide sensitivity range, thus making it the new standard for our NTA devices.

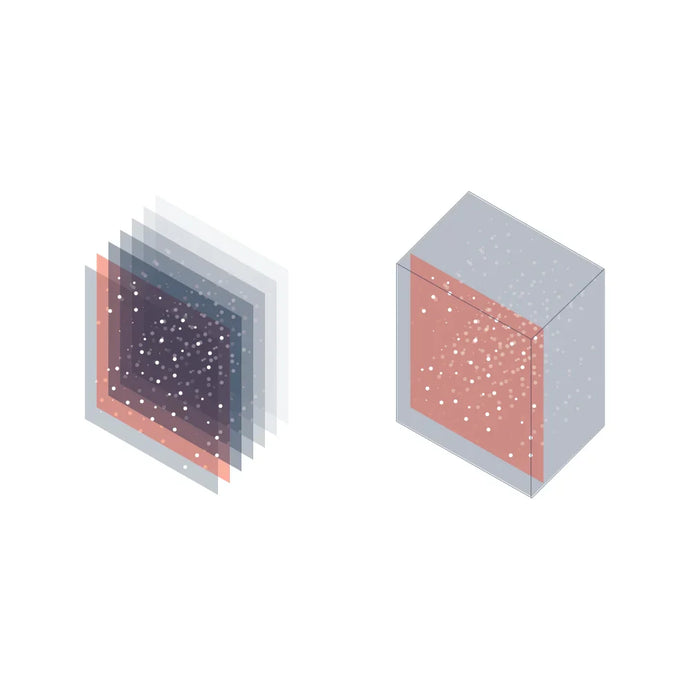
Figure 1: Schematic representation of two different concentration measurement methods. Left: Discrete concentration measurement at 11 positions. Right: Continuous concentration scan through the measurement cell.
Introduction
Concentration determination is an essential measurement method for the precise analysis of nanoparticles, particularly in medicine, life sciences, the pharmaceutical industry, materials science and environmental analysis. It ensures compliance with exact dosages, quality standards as well as regulatory requirements [1, 2]. Determining particle concentration thus plays a key role to exosome and vesicle research, virus and cancer research, vaccine development and the quality control of nanoparticle-based drugs and drug delivery systems [3-5]. In addition, concentration determination is crucial in characterizing synthetic nanoparticles such as gold, silica or polystyrene as well as in the quantification of micro- and nanoplastics in cosmetics, food or water samples [6-9].
The most commonly used techniques for determining the concentration of nanoparticles include dynamic light scattering (DLS), flow cytometry and nanoparticle tracking analysis (NTA). In recent decades, NTA in particular has emerged as the most widely used and popular method for concentration measurement, although improvements and increases in sensitivity have also been achieved in flow cytometry through continuous development [10-12]. By directly counting individual particles, NTA ensures accurate concentration measurement in both scatter and fluorescence modes that works for mono- and polydisperse samples over a wide nanometer range.
However, precise measurements require calibration with reference material and for quantification of particles it is essential to consider the effects of device-specific variables on particle characterization. For instance, the result of a concentration measurement depends on the recording setting and laser power as well as on particular tracking algorithms [13]. A higher camera sensitivity leads to a higher number of particles in the field of view, resulting in a different measurement volume and consequently in a higher particle concentration. In addition, a calibration using specific concentration and fluorescence factors is required for accurate results. Therefore, the choice of optimal instrument settings and sample dilutions is often not trivial for the user, which may make it difficult to compare the results between individual operators or devices.
According to ISO 24672, “The biggest unknown in particle counting with PTA [particle tracking analysis] is sample and instrument dependent depth of field of view and therefore the resultant sensing volume 13.” This applies to measurements conducted at a single as well as at multiple recording positions. We were able to overcome this known limitation and present a new method of concentration measurement. Whereaspreviously the concentration was determined via the number of particles at different, individual measuring positions, our new measuring method uses a microscopy scan to detect all particles across the entire measurement volume. The particle concentration is then determined using an NTA algorithm that is embedded in our new software ZetaSphere (Figure 1). The fast scan enables thousands of particles to be scanned within 12 seconds, which increases the statistics and accuracy of the concentration results. By scanning the entire measurement volume, consistent measurement results can be achieved largely independent of the chosen camera settings, as depth of field issues are eliminated. This feature ensures precise, stable and reproducible measurement results over a large range of camera parameters in both scatter and fluorescence mode for small (50 nm) as well as large particles (500 nm). Users benefit from a greatly simplified approach to concentration measurement, making particle quantification largely independent of recording settings allowing comparable results across different sample types as well as different measurement channels like scatter and fluorescence. In addition, our new concentration measurement does not require any prior concentration calibration, leading to accurate measurement results and improved cross-instrument comparability.
Here we demonstrate the performance of our new concentration scan. The application of different counting standards (100 nm) in multiple devices confirmed the measurement accuracy and stability of our new method. Concentration scans in both scatter and fluorescence mode showed stable concentration values over a wide sensitivity range at different acquisition settings, verifying the minimized influence of camera settings on the measurement results. In addition, measurements of different size standards underlined the stability of the method across a large size range (50-500 nm). Finally, concentration measurements of real samples with unknown size and varying fluorescence revealed precise results, making this method also an ideal application for the concentration determination of EVs and establishing our Concentration Scanning Technology as the new standard for our NTA device.
Results
Validation of the Concentration Scanning Technology using counting standards. The performance of our new Concentration Scanning Technology was validated using commercially available 100 nm counting standards (Figure 2). The concentration scan was performed on different ZetaView® devices using standards from different manufacturers and different materials, including polystyrene and SiO₂. The measured particle concentration is within the confidence interval specified by the manufacturer, and also exhibits a very high device comparability, ensuring reliable, reproducible results with the new scan.

Figure 2: Validation of the concentration scan using different counting standards. The experiments were conducted on different devices to assess device comparability. The results are in excellent agreement with the particle manufacturers' specifications.
Reduced influence of recording settings
So far, concentration measurement results have depended on the chosen recording settings, which made calibration necessary for each setting. To address this, we compared the newly developed concentration scan with the NTA concentration measurement method, which complies with ISO 24672. This method is calibrated using a 100 nm polystyrene standard and is referred to as the '11-position measurement' in the following.
The concentration of 100 nm polystyrene counting standards was determined for different camera settings (Figure 3). The results show that the scan remains accurately within the manufacturer’s concentration acceptance range, even with significant changes in camera gain. In contrast, the 11-position measurement provides valid results only for the calibrated recording settings (gain 30). This demonstrates the enhanced tolerance range of the concentration scan regarding the recording settings and is particularly helpful for unknown samples, for which the camera settings need to be adjusted.
This feature can be explained by the underlying properties of the different measurement methods. In the conventional ISO-compliant method, particles are detected within a light sheet, and their concentration is determined using a calibration factor. However, the number of detected particles is directly influenced by the camera settings. An increase in camera sensitivity enlarges the detection volume, leading to the detection of more particles. Consequently, camera settings have a direct impact on the measured concentration, as demonstrated by the increase in concentration with higher gain settings. This makes calibration necessary in order to obtain accurate absolute concentration results. Notably, this effect is significantly reduced by our new Concentration Scanning method. It detects particles within a predefined measurement volume, independent of the detection volume, which is influenced by the laser and camera settings. This is reflected in the stable concentration values observed across different sensitivity settings. It is important to note that increasing the gain within a reasonable range does not artificially alter the measurement volume. Instead, it primarily affects the detection of smaller or weakly scattering or fluorescent particles. However, the upper sensitivity limit is constrained at the point at which noise leads to false positive detections.

Figure 3: Concentration measurements of a 100 nm polystyrene standard. Comparison of the concentration scan and the 11-position measurement under different camera settings, demonstrating that the scan achieves accurate results across all gain variations, while the 11-position measurement achieves accurate results only for the gain level determined by calibration.
Concentration determination of different particle sizes
The reduced influence of camera settings on the measurement results is also observed when measuring nanoparticles across different size ranges. Measurements were conducted with polystyrene samples in the range of 50 nm to 500 nm (Figure 4). While the 11-position concentration measurement method shows excellent agreement with the manufacturer's specifications at 60 nm and 100 nm, the concentration scan provides precise results in an extended measurement range from 50 nm to 500 nm, without the need for further calibration, which is particularly advantageous for analyzing samples with particles of unknown size.

Figure 4: Concentration measurement of polystyrene particles in the range of 50 – 500 nm. The concentration scan agrees with the manufacturers´ specifications across the entire particle size range, whereas the 11-position measurement, calibrated for 100 nm, overestimates particles in the 200 – 500 nm range, proving the need for accurate calibration for being able to achieve absolute concentration values by this method.
Concentration measurements of samples labeled with four fluorescent dyes per particle
The dependence of results on recording settings is not only evident for different particle sizes, but especially for fluorescent samples. Here, the intensity of the scattered light from the particles and the emitted fluorescence from the fluorophores differs significantly depending on particle size and number of fluorophores. Additionally, each laser has a unique beam profile and intensity, which must be considered in the conventional NTA concentration method by determining a concentration correction factor using fluorescent reference beads. The stability of the concentration scan regarding fluorescence was analyzed through concentration measurements of fourfold labeled samples (Figure 5). In the concentration scan, all concentration values show a deviation of less than 5%, indicating measurement consistency over all channels. In contrast, measurements taken at 11 different positions exhibit significant variance, as they are more strongly affected by the laser profile and the specific camera settings.

Figure 5: Concentration measurements of 100 nm sized particles, labeled with 4 different fluorophores (TetraSpeck™). Comparison of the particle concentration within each fluorescence (F) and scatter (S) channel. The results of the concentration scan for all channels are within a 5% acceptance range relative to the manufacturer's specified concentration values. The included fluorescence calibration demonstrates the concentration result with a fluorescence channel specific calibration.
Concentration determination of PAN- and CD63-EGFP-labelled EVs

Figure 6: Comparison of the concentration scan and 11-position measurement for PAN- and EGFP-labelled EVs. For CD63-EGFP labelled EVs, the concentration scan provides results that exactly confirm the EVs specifications.
The advantages of the concentration scan can equally be applied to real samples such as EVs with unknown size (Figure 6). CD63-EGFP EVs from HEK293 cells (#700378/700377), available in our online shop, were stained with the Particle Metrix F-NTA EV Tetraspanin Detection Kit 520 (#700388) according to the instructions provided in the protocol. It contains three antibodies directed against the exosome markers CD9, CD63 and CD81 (https://www.particle-metrix.com/products/f-nta-antibodies-f-nta-ev-tetraspanin-detection-kit?variant=50339633561930). With our new scanning technology, the concentration of the CD63-EGFP positive fraction detected in fluorescence channel 488F500 delivers results that exactly match EV specifications (1.4x10¹⁰ particles per ml). In contrast, the measurements at 11 different positions show a lower concentration, as they are more strongly influenced by the laser profile, specific camera settings and previous fluorescence calibrations. However, similar results presumably could have been achieved with prior calibration. This fact can be transferred to the results of the tetraspanin PAN-stained fraction in the 520F550 fluorescence channel, which contains CD9 and CD81 positive EVs in addition to CD63 as well as to the scatter results. Despite the same camera settings, higher concentration values can be achieved with the concentration scan than with the 11-position measurement, making the new measurement technique a more sensitive and versatile application method.
Conclusion
With our new Concentration Scanning Technology we developed a novel measurement method for determining the concentration of nanoparticles, by combining a volumetric scan with NTA technology. Particle detection throughout the entire measurement volume enables concentration measurements without the need for individual calibration, like necessary for samples, which differ in particle size, material or fluorescence. In addition, compared to conventional NTA concentration measurements, the cell scan exhibits reduced sensitivity towards acquisition parameters such as camera gain, shutter or used laser/filter combination. These unique properties enable accurate concentration measurements of polystyrene particles over a size range of 50 – 500 nm without the need for prior individual calibration. Furthermore, it has been shown that concentration measurements with varying camera settings provide identical results, which increases result stability and instrument comparability. This simplifies the setup of new measurement configurations for samples and reduces the need for manual adjustments. In addition, these advantages can also be applied to the measurement of fluorescent particles, where different lasers and filters are used. Four-fold labeled particles were measured with identical concentrations in scatter as well as in all four fluorescence channels within a 5% acceptance interval. Finally, we demonstrated that the concentration scan is ideally suited for the measurement of extracellular vesicles. The calibration-free concentration scan also showed robust and reliable concentration results in the experiments with the EGFP-labeled HEK-EVs, which represent biological samples with unknown size and different fluorescence.
References
1. Zölls, S. et al. Particles in therapeutic protein formulations, Part 1: overview of analytical methods. Journal of pharmaceutical sciences 101, 914–935; 10.1002/jps.23001 (2012).
2. Gross, J., Sayle, S., Karow, A. R., Bakowsky, U. & Garidel, P. Nanoparticle tracking analysis of particle size and concentration detection in suspensions of polymer and protein samples: Influence of experimental and data evaluation parameters. European journal of pharmaceutics and biopharmaceutics : official journal of Arbeitsgemeinschaft fur Pharmazeutische Verfahrenstechnik e.V 104, 30–41; 10.1016/j.ejpb.2016.04.013 (2016).
3. Patois, E., Capelle, M., Palais, C., Gurny, R. & Arvinte, T. Evaluation of nanoparticle tracking analysis (NTA) in the characterization of therapeutic antibodies and seasonal influenza vaccines : pros and cons. Journal of Drug Delivery Science and Technology 22, 427–433; 10.1016/S1773-2247(12)50069-9 (2012).
4. Dragovic, R. A. et al. Sizing and phenotyping of cellular vesicles using Nanoparticle Tracking Analysis. Nanomedicine : nanotechnology, biology, and medicine 7, 780–788; 10.1016/j.nano.2011.04.003 (2011).
5. Singh, S. K. et al. An industry perspective on the monitoring of subvisible particles as a quality attribute for protein therapeutics. Journal of pharmaceutical sciences 99, 3302–3321; 10.1002/jps.22097 (2010).
6. Huber, M. J. et al. Physicochemical characterization and quantification of nanoplastics: applicability, limitations and complementarity of batch and fractionation methods. Analytical and Bioanalytical Chemistry 415, 3007–3031; 10.1007/s00216-023-04689-5 (2023).
7. Tian, Y., Tian, D., Peng, X. & Qiu, H. Critical parameters to standardize the size and concentration determination of nanomaterials by nanoparticle tracking analysis. International journal of pharmaceutics 656, 124097; 10.1016/j.ijpharm.2024.124097 (2024).
8. James, A. E. & Driskell, J. D. Monitoring gold nanoparticle conjugation and analysis of biomolecular binding with nanoparticle tracking analysis (NTA) and dynamic light scattering (DLS). The Analyst 138, 1212–1218; 10.1039/c2an36467k (2013).
9. Oliveira, E. M. de et al. Study of the polystyrene degradation in water using nanoparticle tracking analysis (NTA). Tecnol. Metal. Mater. Min. 20, e2347; 10.4322/2176-1523.20222347 (2023).
10. Filipe, V., Hawe, A. & Jiskoot, W. Critical evaluation of Nanoparticle Tracking Analysis (NTA) by NanoSight for the measurement of nanoparticles and protein aggregates. Pharmaceutical research 27, 796–810; 10.1007/s11095-010-0073-2 (2010).
11. Görgens, A. et al. Optimisation of imaging flow cytometry for the analysis of single extracellular vesicles by using fluorescence-tagged vesicles as biological reference material. Journal of extracellular vesicles 8, 1587567; 10.1080/20013078.2019.1587567 (2019).
12. Ribeiro, L. N. d. M., Couto, V. M., Fraceto, L. F. & Paula, E. de. Use of nanoparticle concentration as a tool to understand the structural properties of colloids. Scientific reports 8, 982; 10.1038/s41598-017-18573-7 (2018).
13. ISO/TS 24672:2023. Nanotechnologies – Guidance on the measurement of nanoparticle number concentration.