Assessment of Extracellular Vesicle Purity Using ZetaView® Fluorescence NTA (F-NTA) in Comparison to Flow Cytometry and TRPS
Dr. Christina Klasen
Particle Metrix GmbH, Inning, Germany
Abstract
Extracellular vesicles (EVs) are increasingly investigated as biomarkers and functional mediators in biomedical research, bioprocess development, and translational applications. A critical challenge in EV characterization is the reliable assessment of sample purity, as commonly used isolation methods frequently co-isolate non-vesicular particles such as protein aggregates, lipoproteins, or cell debris.
Standard nanoparticle tracking analysis (NTA) provides robust information on particle size and concentration but does not intrinsically distinguish vesicular from non-vesicular particles. As a result, high particle counts may be misinterpreted as high EV yields, potentially leading to incorrect conclusions regarding isolation efficiency, downstream functionality, or comparability between samples.
Fluorescence-based approaches offer a strategy to overcome this limitation by selectively detecting particles that exhibit vesicle-specific features. Membrane dyes enable the identification of membrane-enclosed particles, while antibody-based labeling of tetraspanins such as CD9, CD63, and CD81 provides molecular specificity for extracellular vesicles. The combination of scatter-mode NTA with fluorescence NTA (F-NTA) therefore enables a quantitative differentiation between total particles and vesicular subpopulations within the same sample.
In this application note, fluorescence NTA using the ZetaView® system is applied to assess the purity of EV preparations by comparing total particle concentrations with membrane-positive and tetraspanin-positive fractions. The approach is benchmarked against established technologies, including flow cytometry and tunable resistive pulse sensing (TRPS), to highlight methodological differences and practical implications for EV purity analysis.
Methods
Antibody staining of EVs
Labeling of the EVs was performed in accordance with the protocol provided in the F-NTA EV Tetraspanin Detection Kit 520: 1µl of the EV sample was incubated for one hour with 1µl of the prediluted F-NTA Tetraspanin EV Detection Kit 520 (1µl anti-CD9, 1µl anti-CD63 and 1µl anti-CD81 diluted in 27µl PBS). Before analysis, the sample was diluted with 998µL PBS.
Link to F-NTA EV Tetraspanin Detection Kit: F-NTA EV Tetraspanin Detection Kit | Particle Metrix – Particle Metrix GmbH
Membrane staining of plasma EVs
For the labeling of membrane-enclosed particles, 1µl of the EV sample was incubated for one hour with 1µl of CellMask™ Deep Red (Thermo Fisher Scientific), diluted 1:2000 in PBS. Before analysis, the sample was diluted with 998µL PBS.
NTA and F-NTA Analysis
Measurements were performed on the ZetaView® Evolution quatt instrument using the ZetaSphere Software. The measurement settings of the PMX EV PAN Staining method were applied for all analyses.
Link to ZetaView Evolution: ZetaView® Evolution – Advanced Nanoparticle Tracking – Particle Metrix GmbH
Extracellular Vesicles
10µg of lyophilized exosomes from human thrombocytes of healthy donors have been resuspended in 10µl of H2O and have been used for the described experiments.
Link to Lyophilized Exosomes: Lyophilized Exosomes from Human Platelets for EV Research | Particle Metrix – Particle Metrix GmbH
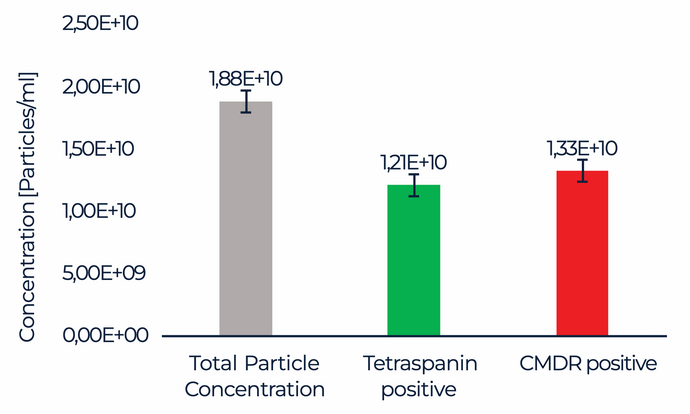
Result a)

Result b)

Result c)

Figure 1: Exemplary results of EV purity analysis by ZetaView®. NTA and F-NTA measurement of exosomes isolated from human thrombocytes of healthy donors stained with F-NTA EV Tetraspanin Detection Kit 520 and Cell Mask Deep Red. a) Concentration of all particles in the sample (scatter mode), tetraspanin positive particles and membranous particles. Result of 3 independent experiments. b) Size distribution of NTA and F-NTA measurements. Exemplary result. c) Calculated purity of tetraspanin positive and membranous fraction.
Comparison to Alternative Technologies
Fluorescence NTA vs. Flow Cytometry
Flow cytometry (FCM) enables phenotypic EV analysis but relies on indirect principles for size and concentration determination. EV size is typically inferred from light-scattering intensity using calibration beads, assuming defined refractive indices and particle geometry.
However, commonly used calibration beads, such as silica or polystyrene beads, differ substantially from EVs in composition and optical properties. As EVs exhibit heterogeneous structures and lower refractive indices, the resulting size estimates represent only an approximation rather than absolute physical dimensions.
Similarly, EV concentration in FCM is commonly derived from the estimated volume of the core stream passing the detection region. Variations in fluidics and flow stability can introduce additional uncertainty in volumetric measurements.
In contrast, ZetaView® determines EV size and concentration without the need for external calibration standards. Particle size is derived from the analysis of Brownian motion, while concentration is obtained from absolute particle counts within a defined observation volume. This applies consistently to scatter and fluorescence measurements, enabling accurate quantification of total particles and labeled EV subpopulations within the same assay.
Fluorescence NTA vs. Tunable Resistive Pulse Sensing (TRPS)
Tunable resistive pulse sensing (TRPS) provides high-resolution particle size and concentration measurements based on transient changes in electrical resistance as particles traverse a nanopore. While this technique offers excellent size discrimination, it typically lacks intrinsic molecular specificity and requires separate labeling or orthogonal assays to identify EV subpopulations.
In addition, TRPS measurements are comparatively time-intensive, as samples are analyzed sequentially and measurement duration strongly depends on particle concentration, pore stability, and clogging behavior. Typical measurement times can range from 20 to 60 minutes per sample, including pore calibration and stabilization.
Fluorescence NTA measurements with the ZetaView® system are generally completed within a few minutes per sample, while simultaneously providing particle size, concentration, and molecular identity through fluorescence labeling. This enables higher throughput and more efficient workflows, particularly in comparative studies or quality control environments.
Discussion
The presented results demonstrate how fluorescence NTA enables a quantitative assessment of EV purity by distinguishing total particle counts from vesicle-specific subpopulations within a single measurement. By comparing scatter-mode NTA with fluorescence detection of membrane-enclosed and tetraspanin-positive particles, non-vesicular contributions to the total particle concentration can be readily identified.
Membrane dye staining provides an estimate of the fraction of membrane-enclosed particles, while antibody-based labeling of EV tetraspanins adds molecular specificity. The use of the Particle Metrix F-NTA EV Tetraspanin Detection Kit enables standardized and reproducible labeling of established EV markers (CD9, CD63, CD81), supporting consistent identification of vesicular subpopulations across measurements. Compared to alternative technologies, fluorescence NTA combines direct particle sizing and absolute concentration determination with molecular specificity. While flow cytometry and TRPS offer complementary strengths, fluorescence NTA uniquely enables rapid, quantitative comparison of total particles and labeled EV fractions within the same analytical workflow.Overall, fluorescence NTA provides a practical and efficient approach for evaluating EV purity, supporting the optimization of isolation protocols and routine quality control of EV preparations.
Conclusion
F-NTA using the ZetaView® system enables a rapid and quantitative assessment of EV purity by combining particle size, absolute concentration, and vesicle-specific fluorescence detection within a single measurement. While flow cytometry and tunable resistive pulse sensing provide complementary information for EV characterization, fluorescence NTA uniquely allows direct comparison of total particle counts with vesicle-specific subpopulations in a time-efficient workflow. The use of standardized tetraspanin antibody kits supports reproducible identification of EVs, making fluorescence NTA a practical approach for EV research, method development, and routine quality control.
References
1. Welsh JA, Goberdhan DCI, O’Driscoll L, Théry C, Witwer KW, et al.: Minimal information for studies of extracellular vesicles (MISEV2023): From basic to advanced approaches. J Extracell Vesicles. 2024;13(2): e12404. doi:10.1002/jev2.12404
2. van der Pol E, Sturk A, van Leeuwen TG, Nieuwland R, Coumans FAW.: Standardization of extracellular vesicle measurements by flow cytometry through vesicle diameter approximation. J Thromb Haemost. 2018;16(6):1236–1245. doi:10.1111/jth.14009
3. Coumans FAW, van der Pol E, Böing AN, et al.: Reproducible extracellular vesicle size and concentration determination with tunable resistive pulse sensing. J Extracell Vesicles. 2014;3:25922. doi:10.3402/jev.v3.25922