Physical characterization of adenoviral and lentiviral vector preparations using ZetaView® nanoparticle tracking analysis
Dr. Christina Klasen, Dr. Lena Ball
Particle Metrix GmbH, Inning, Germany
Abstract
Reliable physical characterization of viral vector preparations is essential for vector development, batch comparability, and process monitoring. Commonly used biological assays, such as plaque assays, TCID₅₀ assays, or quantitative PCR, primarily assess functional infectivity or genome content but provide limited information on particle size and absolute total particle numbers.
Infectivity-based assays are indispensable for determining viral functionality and biological potency; however, they typically require several days to complete and rely on cell culture systems, which introduce biological variability and increased experimental complexity. While these methods quantify infectious units, they do not directly measure the total number of physical virus particles present in a preparation.
In contrast, nanoparticle tracking analysis (NTA) enables rapid, label-free quantification of total virus particles within minutes by directly analyzing individual particles in suspension. The method is based on optical tracking of Brownian motion, allowing simultaneous determination of hydrodynamic particle size and absolute particle concentration at the single-particle level (Bachurski et al., 2019). NTA has been validated for rapid total virus particle quantification in comparison with conventional infectivity-based assays (Kramberger et al., 2012).
Due to its high measurement speed and independence from biological readouts, NTA is particularly well suited for routine control measurements, especially for monitoring concentration changes over time during production, purification, or storage.
In this study, adenoviral (AdV) and lentiviral vector (LVV) preparations from different sources were analyzed using the ZetaView® platform to determine particle size distributions and absolute particle concentrations based on light-scattering NTA.
All vector preparations exhibited monomodal size distributions within a narrow nanoscale range without detectable aggregation, with mean particle sizes ranging from approximately 100 to 130 nm. Despite the similar size profiles, particle concentrations differed by more than two orders of magnitude between preparations, reflecting expected variability introduced by upstream production, downstream purification, and formulation. Importantly, by applying appropriate dilutions within the instrument’s optimal working range, NTA enabled precise quantification across this broad concentration window. Repeated measurements (n = 5) demonstrated high intra-assay reproducibility for both particle size and concentration, and serial dilution experiments confirmed linear concentration measurements and stable size determination across the tested range.
These results demonstrate that nanoparticle tracking analysis provides robust and reproducible quantitative information that complements biological titer assays. While fluorescence-based NTA enables selective analysis of labeled particle subpopulations, the present study focuses on label-free measurements to highlight the core capabilities of NTA as a practical tool for routine physical characterization of adenoviral and lentiviral vector preparations.
Methods
Viral vector preparations and dilution
Two independent batches of adenoviral vectors (AdVs) and lentiviral vectors (LVVs) were analyzed. Purified viral vector preparations were supplied and subjected to independent analytical quality control prior to experimental use.
For measurement, each preparation was diluted in sterile phosphate-buffered saline (PBS) to three concentrations within the instrument’s optimal operating range.
Nanoparticle tracking analysis (NTA)
Particle size distributions and concentrations were determined using a ZetaView® Evolution quatt system (Particle Metrix GmbH, Germany). Measurements were performed using the 488 nm laser module under standardized acquisition settings (camera gain: 57; shutter: 200).
For each dilution, five consecutive measurements were recorded to assess intra-assay reproducibility. Data analysis was performed using the instrument software under standard evaluation settings. Mean particle size and particle concentration were calculated based on the five replicate measurements per dilution.
Results
Physical characterization of adenoviral and lentiviral vector preparations by NTA
Nanoparticle tracking analysis was used to characterize the particle size distributions and concentrations of different adenoviral (AdV) and lentiviral vector (LVV) preparations, consistent with previously described applications of NTA for total virus particle determination (Kramberger et al., 2012).
All samples were optically clear and showed no visible signs of aggregation.
Particle size distributions
All analyzed preparations showed monomodal size distributions without detectable aggregation. However, lentiviral vector (LVV) samples exhibited slightly broader distributions compared to adenoviral vectors (AdVs). In addition, LVVs consistently displayed larger mean particle sizes (123–128 nm) than AdVs (103–104 nm), reflecting intrinsic structural differences between the vector systems.
These findings highlight the capability of nanoparticle tracking analysis to resolve subtle yet consistent size differences between viral vector preparations within a relatively narrow nanoscale range.
Figure 1

Figure 1: a) Size distribution (representative) and b) median size of adenoviral and lentiviral vector preparations determined by nanoparticle tracking analysis. Error bars represent standard deviation (n = 5).
Particle concentration measurements
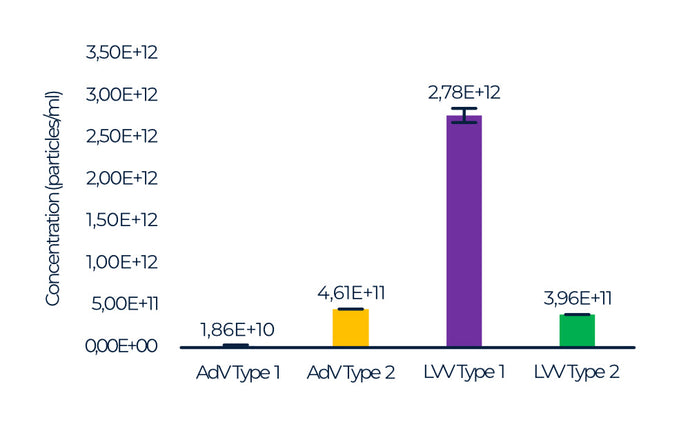
Absolute particle concentrations determined by NTA varied over more than two orders of magnitude between the analyzed preparations (Figure 2).
Measured concentrations ranged from 1.86 × 10¹⁰ particles/mL (AdV Type 1) to 2.78 × 10¹² particles/mL (LVV Type 1).
Repeated measurements (n = 5) showed low intra-assay variability for particle concentration, indicating robust and reproducible quantification by the ZetaView® platform.
Figure 2

Figure 2: Absolute particle concentrations of adenoviral and lentiviral vector preparations determined by nanoparticle tracking analysis. Error bars represent standard deviation (n = 5).
Differentiation of viral vector preparations by particle size and concentration
Mean particle size and particle concentration constitute independent physical parameters that can be quantified simultaneously by nanoparticle tracking analysis (Figure 3). Despite falling within a similar nanoscale range, the analyzed viral vector preparations exhibit substantial differences in particle concentration, reflecting variations introduced by production, purification, and formulation processes rather than size-related effects. This highlights the value of NTA as a comprehensive tool for comparative physical characterization of viral vector preparations.
Figure 3

Figure 3: Relationship between mean particle size and particle concentration for different viral vector preparations.
Linearity and repeatability across dilutions
To assess measurement linearity, selected viral vector preparations were analyzed across serial dilutions. Measured particle concentrations scaled linearly with the applied dilution factors over the tested concentration range (Figure 4), demonstrating that NTA accurately reflects true concentration changes without systematic under- or overestimation.
Figure 4

Figure 4: Linearity of nanoparticle tracking analysis measurements across serial dilutions of viral vector preparations. Measured particle concentrations scale linearly with dilution. Error bars represent standard deviation (n = 5). The linear regression (blue dotted line) showed a high coefficient of determination (R² = 0.991), indicating an excellent fit.
In addition, particle size measurements remained stable across dilutions within the optimal measurement range, demonstrating that dilution did not introduce systematic bias in size determination. (Figure 5)
Together, these results confirm nanoparticle tracking analysis as a reliable and reproducible method for the physical characterization of viral vector preparations in terms of particle size and concentration.
Figure 5

Figure 5: Mean particle size of AdV Type 1 (a) and LVV Type 2 (b) across three measured dilutions. Error bars represent standard deviation (n = 5).
Conclusion
Robust physical characterization of viral vector preparations remains essential for vector development, batch comparability, and process monitoring.
In this study, nanoparticle tracking analysis using the ZetaView® platform enabled robust, label-free characterization of adenoviral and lentiviral vector preparations by delivering reproducible measurements of particle size distributions and absolute particle concentrations across different vector types and sources. Although both vector types fell within a similar nanoscale range, lentiviral vectors consistently exhibited larger mean particle sizes and slightly broader size distributions compared to adenoviral vectors.
Importantly, particle concentration represented an independent parameter, with substantial differences observed between preparations, underscoring the value of direct particle counting methods as a complement to functional assays. Linearity across serial dilutions and low intra-assay variability further support the suitability of NTA for routine analytical workflows.
While the present work focuses on light-scattering-based, label-free measurements, the ZetaView® platform also supports fluorescence nanoparticle tracking analysis for the selective characterization of labeled particle subpopulations, as previously demonstrated for adenovirus detection using combined light-scattering and fluorescence NTA approaches (Gast et al., 2019). This additional capability expands the applicability of NTA to more complex virological questions, while the results presented here establish a practical and robust foundation for routine physical characterization of viral vector preparations.
References
1. Bachurski D, Schuldner M, Nguyen P-H, et al.: Extracellular vesicle measurements with nanoparticle tracking analysis – An accuracy and repeatability comparison between NanoSight NS300 and ZetaView. J Extracell Vesicles. 2019;8:1596016. doi:10.1080/20013078.2019.1596016
2. Kramberger P, Ciringer M, Štrancar A, Peterka M.:
Evaluation of nanoparticle tracking analysis for total virus particle determination. Virol J. 2012;9:265. doi:10.1186/1743-422X-9-265
3. Gast M, Sobek H, Mizaikoff B.: Nanoparticle tracking of adenovirus by light scattering and fluorescence detection. Hum Gene Ther Methods. 2019;30:235–244. doi:10.1089/hgtb.2019.172